This is a a guide to help prepare, organize, and analyze your creative performance data to uncover meaningful insights. It is designed for advertisers and marketers who want to test their ad creatives using CPM (Cost Per Mille) as a key metric. By outlining critical metadata requirements, segmentation strategies, and best practices for data correlation, this guide helps ensure your testing is both accurate and actionable.
| Name | Type | Description | If missing... |
|---|---|---|---|
| Ad ID | Metadata | Unique ID for a specific ad | Data may not link correctly; delays and mismatches likely. |
| Campaign ID/Name | Metadata | Identifies and groups creatives by campaign | Can't analyze creative-level performance from campaign-level data. |
| Ad Set ID / Ad Group ID | Metadata | Identifies groups of ads with shared targeting or bidding | Group-level differences can’t be analyzed. |
| Platform / Placement Type | Metadata | Specifies where and how the ad appeared (e.g., Meta, Facebook News Feed) | CPM and other metrics vary by placement; omitting leads to misleading results. |
| Asset Type | Metadata | Indicates if ad is display or video | Impacts score relevance; video and display behave differently. |
| Campaign Objective | Metadata | Describes campaign goal (e.g., awareness, conversion) | Optimization logic varies by goal; data may be misinterpreted. |
| Spend | Metric | Total ad spend (preferably in a uniform currency) | CPM can’t be calculated if impressions are provided alone. |
| Impressions | Metric | Total ad views | Needed to calculate CPM and assess campaign scale. |
| CPM | Metric | Cost per 1,000 impressions | Can be derived from spend + impressions if missing. |
| Conversions | Metric | Number of conversion events | Can’t calculate conversion rate; high CPM may be justified by high conversions. |
| CPA (Cost per Acquisition) | Metric | Average cost per conversion | Less important if you have conversion counts; CPA adds context. |
| Lift Measures | Metric | Brand lift or similar metrics | Optional; adds value for awareness campaigns but may be noisy. |
| Campaign Dates | Dates | Start and end dates of the campaign | Needed to track campaign duration and identify potential performance patterns. |
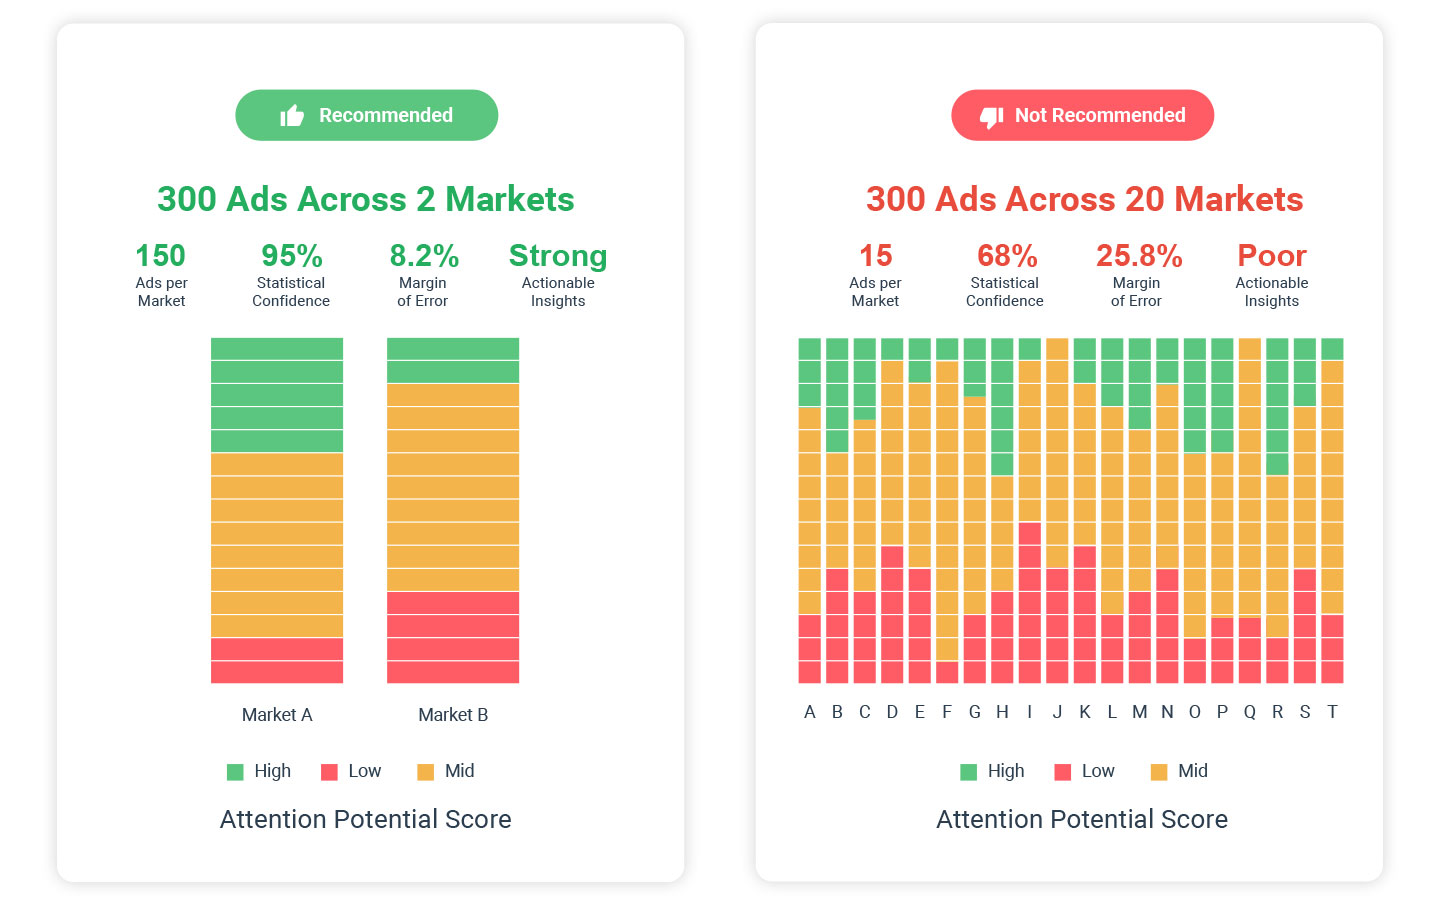
Balancing Ad Portfolios
To the extent it is possible, it is advisable to create some homogeneity in terms of markets and ad formats (so as to have a higher sample size across both) and ensure some visual diversity and campaign grouping in the sample of ads chosen.
In other words, if preparing a set of 300 ads, we’d recommend 1-2 markets and 2-4 placement types from a diverse set of campaigns, as opposed to a 300-ad set coming from 20 different markets but pulled from a handful of campaigns.
If ads’ video length is particularly distinct across platforms/placements, it may also be necessary to control for the effect of video length (for instance by categorising the ads as short and long form and ensuring results are consistents, or if applicable, treating video length as a covariate (and measuring a partial correlation coefficient).
Pairing API Model Parameters to Performance Data Granularity
If spend and impression figures are aggregated at the audience level (e.g. 24-35 x Female) it may well be worth processing Synthetic measurements with compatible parameters and adding age group and gender to the list of dimensions used to partition the correlation analysis (see below).
Conversely, to keep the correlation analysis as simple as possible, spend and impression figures may have to be summed up to form an aggregated CPM figure at the ad-placement level.
Segmenting Correlation Computations
A direct correlation calculation that mixes ads coming from heterogeneous contexts and objectives is very likely to mask or dilute any meaningful signal.
Context
- At a minimum, by platform. Ideally, by platform and placement type
- Ad platforms have a significant impact on the distribution of CPM values, including the baseline CPM that can be commanded.
- Under the hood, different placement types will command different CPMs, influence viewability and engagement rates too and interfere or not with organic attention (for instance, by forcing viewplay for a fixed number of unskippable seconds)
- Therefore, we do expect correlations between CPM and synthetic metrics to show significant differences
Ad Types
- For Attention Potential, we expect video ads to have the highest propensity to yield strong association signals, but in any case, we recommend separating video ads from display ads
Objectives
- We have found the most consistent ties between CPM and synthetic metrics when narrowing down our focus to conversion campaigns.
Markets
- It is usually worth, when an ad portfolio comprises meaningfully distinct markets to also slice the correlation analysis by market.
Summary
A correlation analysis that segments the data by platform, placement, ad type, and campaign objective is more likely to yield significant and meaningful results.
Using Robust Correlation Methods
Spend and impression figures are typically long-tailed and, in our experience, often embed aberrations for a small fraction of the data. This consequently affects the reliability of CPM figures.

Outlier Detection
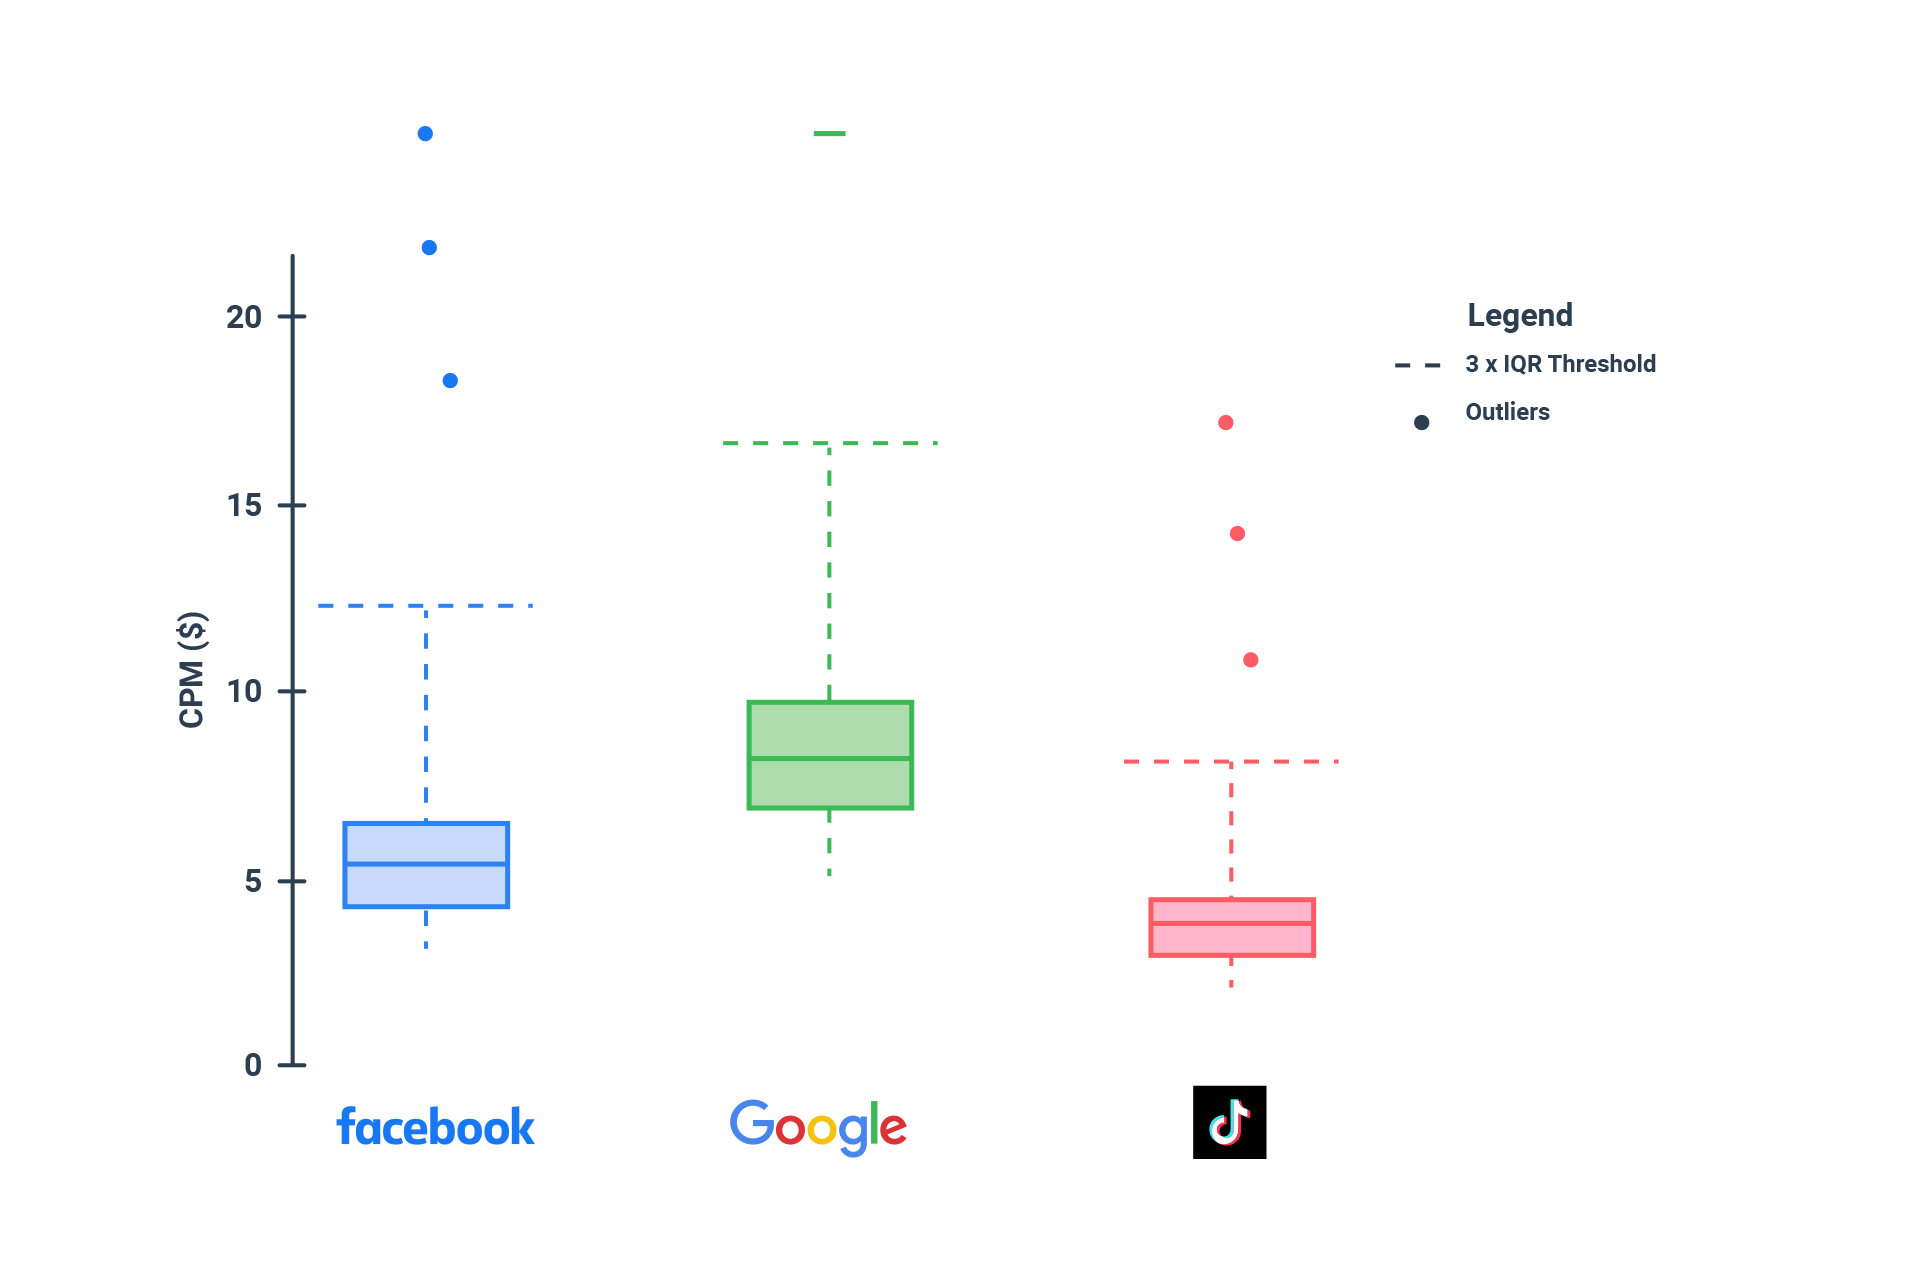
Where possible, we recommend evaluating the presence of at a minimum univariate outliers, and considering the exclusions of extreme outliers (for instance, sitting above 3 times the InterQuantile Range distance, i.e. x > median + 3IQR).
Outlier detection should also be performed by the platform since the distribution of CPM score can be significantly different by platform.
Even though we recommend the use of robust methods anyway, outlier detection may help flag otherwise unknown issues in the data and improve data quality (either through correction or data exclusion).
Robust Correlations
The most frequently used correlation coefficient, Pearson’s r, is very sensitive to outliers, and we strongly advise against its use. We typically either use the Percentage-Bend correlation coefficient (which weighs down the influence of extreme values) or the Spearman rank coefficient (which relies on ranks in the data rather than the variable’s values), the latter being preferred especially when non-linear relationships are expected.
In practice, on large sample sizes (e.g. 100-10,000 ads), we have often found that weak, non-significant correlations under Pearson hid meaningful associations masked by outliers. Conversely, on low sample sizes (e.g. 20-40 ads), we have often found that outliers could yield high r scores despite no clear relationship.
Interpretations
We have detected multiple times that a higher Attention Potential score can be linked to cheaper CPM. Further, we have recently brought evidence, via causality modelling, that such a pattern can be explained mechanically by stronger-performing ads increasing higher engagement rates, which in turn lower CPM.
Nonetheless, it is also true that correlation does not mean causality, and crucially here, that causality does not mean correlation either.
If a creative is optimised (or selected to go in-flight) with a strong Attention Potential, we do expect it to have higher chances of driving engagements and, through this, of driving media efficiency.
However, this effect may be masked or counteracted by the behaviours of optimisation algorithms and bidding mechanisms. If those results, for instance, in push a given ad to audiences with very low engagement probabilities but high availability, cheap CPMs may be attained independent of ad quality (and likely result in very low conversion or lower-funnel performance).
Conversely, a high production quality ad with an excellent Attention Potential score may also be pushed to an expensive audience, yielding high CPM, which may be to the benefit of a higher conversion rate. Both those patterns, which are out of control of the creative quality assessment step itself, would yield a positive correlation between CPM and Attention Potential, without violating the mechanical explanation that ties high Attention Potential to lower CPMs.